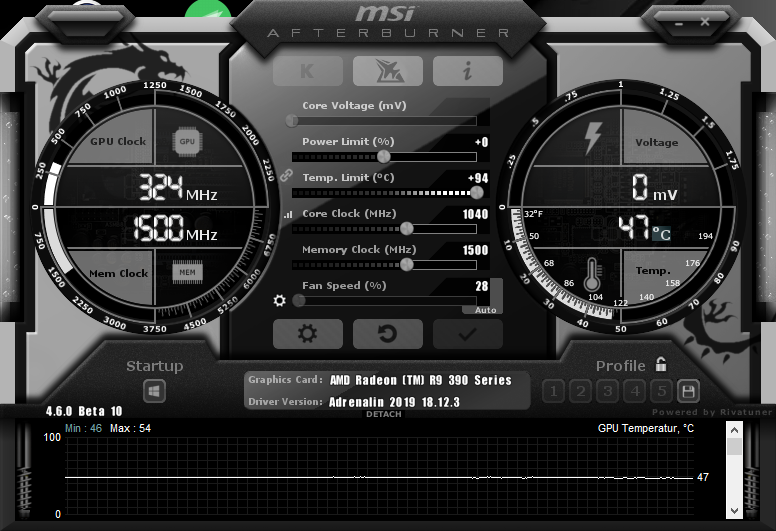
MSI Afterbur┬Łner ist ein ├£ber┬Łtak┬Łtungs┬Łtool f├╝r Gra┬Łfik┬Łkar┬Łten, dass trotz des Namens auch bei Nvi┬Łdia- und AMD-Gra┬Łfik┬Łkar┬Łten von ande┬Łren Her┬Łstel┬Łlern funk┬Łtio┬Łniert und vom ŌĆ£Guru3D Riva┬ŁT┬Łuner TeamŌĆØ ent┬Łwi┬Łckelt wur┬Łde. Neben der ├£ber┬Łtak┬Łtung bie┬Łtet es Funk┬Łtio┬Łnen zur ├£ber┬Łwa┬Łchung der wich┬Łtigs┬Łten Ein┬Łstel┬Łlun┬Łgen der Gra┬Łfik┬Łkar┬Łte, zum Erstel┬Łlen von Screen┬Łshots und Video┬Łauf┬Łzeich┬Łnun┬Łgen sowie ein Over┬Łlay in Spielen.
Added vol┬Łta┬Łge con┬Łtrol for refe┬Łrence design NVIDIA GeForce RTX 20x0 series gra┬Łphics cards
Advan┬Łced GPU Boost con┬Łtrol for NVIDIA GeForce RTX 20x0 series gra┬Łphics cards. Exten┬Łded voltage/frequency cur┬Łve edi┬Łtor on GeForce RTX 20x0 fami┬Łly gra┬Łphics cards allows you to tune addi┬Łtio┬Łnal pie┬Łce┬Łwi┬Łse power/frequency flo┬Łor and temperature/frequency flo┬Łor cur┬Łves. Con┬Łtrol points on tho┬Łse new cur┬Łves allow you to con┬Łtrol GPU Boost power and ther┬Łmal thrott┬Łling algo┬Łrith┬Łms more pre┬Łcis┬Łe┬Łly than tra┬Łdi┬Łtio┬Łnal power limit and ther┬Łmal limit sliders
Hard┬Łware abs┬Łtrac┬Łtion lay┬Łer has been revam┬Łped to pro┬Łvi┬Łde sup┬Łport for mul┬Łti┬Łple inde┬Łpen┬Łdent fans per GPU due to intro┬Łdu┬Łcing dual fan design on refe┬Łrence design NVIDIA GeForce RTX 20x0 series gra┬Łphics cards and due to intro┬Łdu┬Łcing nati┬Łve dual fan con┬Łtrol in NVAPI. Both fans of NVIDIA GeForce RTX 20x0 can be moni┬Łto┬Łred inde┬Łpendent┬Łly in hard┬Łware moni┬Łto┬Łring modu┬Łle now and can be con┬Łtrol┬Łled syn┬Łchro┬Łni┬Łcal┬Łly in manu┬Łal mode
Added NVIDIA Scan┬Łner tech┬Łno┬Łlo┬Łgy support
Added Mono┬Łli┬Łthic Power Sys┬Łtems MP2884A and MP2888A vol┬Łta┬Łge con┬Łtrol┬Łlers support
Added core, memo┬Łry, auxi┬Łlia┬Łry PEXVDD and auxi┬Łlia┬Łry 1V8 vol┬Łta┬Łge con┬Łtrol for cus┬Łtom design MSIRTX 2080Ti Light┬Łning series gra┬Łphics cards with MP2888A + MP2888A +uP1816 vol┬Łta┬Łge regulators
Added VRM and VRM2 tem┬Łpe┬Łra┬Łtu┬Łre moni┬Łto┬Łring for cus┬Łtom design MSIRTX 2080Ti Light┬Łning series gra┬Łphics cards
Impro┬Łved hard┬Łware moni┬Łto┬Łring module:
Added ther┬Łmal off┬Łset for CPU tem┬Łpe┬Łra┬Łtu┬Łre moni┬Łto┬Łring on AMD Ryzen 7 2700X processors
Simi┬Łlar CPU tem┬Łpe┬Łra┬Łtures are now clo┬Łned for all cores on AMD CPUs to pro┬Łvi┬Łde more con┬Łve┬Łni┬Łent and uni┬Łfied On-Screen Dis┬Łplay lay┬Łout bet┬Łween Intel and AMD CPUs
ŌĆ£Page┬Łfi┬Łle usa┬ŁgeŌĆØ graph in hard┬Łware moni┬Łto┬Łring modu┬Łle has been ren┬Ła┬Łmed to ŌĆ£Com┬Łmit chargeŌĆØ
Added group ope┬Łra┬Łti┬Łon noti┬Łfier to the cap┬Łti┬Łon of acti┬Łve hard┬Łware moni┬Łto┬Łring graphs list in ŌĆ£Moni┬Łto┬ŁringŌĆØ tab in the appli┬Łca┬Łti┬Łon pro┬Łper┬Łties. The noti┬Łfier is informing you that you can app┬Łly a set┬Łting to all or to mul┬Łti┬Łple sel┬Łec┬Łted hard┬Łware moni┬Łto┬Łring graphs when you hold group ope┬Łra┬Łti┬Łon key (i.e. <crap> or <Ctrl>) and hover mou┬Łse cur┬Łsor over the set┬Łting that can be appli┬Łed to mul┬Łti┬Łple hard┬Łware moni┬Łto┬Łring graphs at once (e.g. ŌĆ£Show in On-Screen DisplayŌĆØ)
Added ŌĆ£Sel┬Łect by groupŌĆØ and ŌĆ£Sel┬Łect by typeŌĆØ com┬Łmands to con┬Łtext menu of acti┬Łve hard┬Łware moni┬Łto┬Łring graphs list in ŌĆ£Moni┬Łto┬ŁringŌĆØ tab in the appli┬Łca┬Łti┬Łon pro┬Łper┬Łties. New com┬Łmands allow sel┬Łec┬Łting the graphs of exact┬Łly the same type (e.g. CPU1-CPU8 usa┬Łge graphs on eight core CPU) or the graphs with the same OSD/LCD group name (for exam┬Łp┬Łle, GPU clock, GPU power, GPU usa┬Łge and the rest graphs with ŌĆ£GPUŌĆØ group name). Such com┬Łmands allow you to show simi┬Łlar items (e.g. all CPU usa┬Łges) in On-Screen Dis┬Łplay with a sin┬Łgle click or rena┬Łme a group for all child graphs in the sin┬Łgle pass
Mul┬Łti group edit mode is auto┬Łma┬Łti┬Łcal┬Łly sel┬Łec┬Łted now for group name edit field when you enable ŌĆ£Over┬Łri┬Łde group nameŌĆØ opti┬Łon while hol┬Łding <Ctrl> key. You may still manu┬Łal┬Łly togg┬Łle this mode with <Ctrl>+<M> hot┬Łkey any┬Łti┬Łme when editing the group name
On-Screen Dis┬Łplay item type (i.e. text, graph or com┬Łbi┬Łna┬Łti┬Łon of both) is now dis┬Łplay┬Łed in ŌĆ£Pro┬Łper┬ŁtiesŌĆØ column of acti┬Łve hard┬Łware moni┬Łto┬Łring graphs list in ŌĆ£Moni┬Łto┬ŁringŌĆØ tab in the appli┬Łca┬Łti┬Łon properties
Added pro┬Łgramma┬Łble hot┬Łkey for clea┬Łring moni┬Łto┬Łring history
Added ŌĆ£App┬ŁlyŌĆØ but┬Łton to appli┬Łca┬Łti┬Łon pro┬Łper┬Łties win┬Łdow. Now you may ite┬Łra┬Łtively cus┬Łto┬Łmi┬Łze moni┬Łto┬Łring modu┬Łle wit┬Łhout clo┬Łsing the pro┬Łper┬Łties to see the result on each step. Plea┬Łse take a note that some pro┬Łper┬Łties (e.g. appli┬Łca┬Łti┬Łon lan┬Łguage) can┬Łnot be appli┬Łed until you com┬Łple┬Łte┬Łly clo┬Łse pro┬Łper┬Łties win┬Łdow by design of application
Impro┬Łved On-Screen Dis┬Łplay lay┬Łout editor:
Sys┬Łtem reser┬Łved varia┬Łble slots 250ŌĆō255 are now dis┬Łplay┬Łed as sys┬Łtem varia┬Łbles in the lay┬Łout editor
Added embedded graphs sup┬Łport. Embedded graphs can be dis┬Łplay┬Łed direct┬Łly in the text in a sepa┬Łra┬Łte column, it can be con┬Łve┬Łni┬Łent for dis┬Łplay┬Łing per-core CPU usages
Added embedded graph width adjus┬Łt┬Łment varia┬Łble to the ŌĆ£GraphŌĆØ pro┬Łper┬Łty node
Added new ŌĆ£Graph pla┬Łce┬ŁmentŌĆØ pro┬Łper┬Łty node. You can use it to place each graph on top of text, on bot┬Łtom or make it embedded in in text column
Added new varia┬Łbles to ŌĆ£Sepa┬Łra┬ŁtorsŌĆØ pro┬Łper┬Łty node. Now you may defi┬Łne inde┬Łpen┬Łdent sepa┬Łra┬Łtors for the graphs loca┬Łted on top of text part, for the text part and for the graphs loca┬Łted on bot┬Łtom of text part.
Slight┬Łly alte┬Łred inter┬Łpre┬Łta┬Łti┬Łon of pro┬Łlog and epi┬Łlog sepa┬Łra┬Łtors. Plea┬Łse take a note that pro┬Łlog sepa┬Łra┬Łtor is no lon┬Łger auto┬Łma┬Łti┬Łcal┬Łly appen┬Łded with new line sym┬Łbol, so you must spe┬Łci┬Łfy it manu┬Łal┬Łly when neces┬Łsa┬Łry and epi┬Łlog sepa┬Łra┬Łtor is now dis┬Łplay┬Łed below the bot┬Łtom group of graphs
The list of hard┬Łware moni┬Łto┬Łring items in ŌĆ£Add item(s)ŌĆØ dia┬Łlog win┬Łdow is alpha┬Łbe┬Łti┬Łcal┬Łly sor┬Łted now
Added macro┬Łses for embed┬Łding any data from moni┬Łto┬Łring modu┬Łle into OSD text (e.g. pro┬Łlog). You may use macro┬Łses to dis┬Łplay any┬Łthing available in the moni┬Łto┬Łring modu┬Łle, e.g. %CPU temperature%
Impro┬Łved On-Screen Dis┬Łplay hyper┬Łtext for┬Łmat┬Łting per┬Łfor┬Łmance due to more opti┬Łmal macro replace strategy
Revam┬Łped ŌĆ£modern webŌĆØ lay┬Łout. New lay┬Łout is demons┬Łt┬Łra┬Łting new text for┬Łmat┬Łting fea┬Łtures inclu┬Łding big cus┬Łtom frame┬Łra┬Łte coun┬Łter, cus┬Łtom embedded back┬Łground and On-Screed Dis┬Łplay hea┬Łder, cus┬Łtom bench┬Łmark and sys┬Łtem time indi┬Łca┬Łtors and embedded CPU and GPU usa┬Łge graphs
On-Screen Dis┬Łplay lay┬Łouts are saved in moni┬Łto┬Łring pro┬Łfiles now
Impro┬Łved HwIn┬Łfo plugin:
Added UPS load, power, input vol┬Łta┬Łge and char┬Łge level data sources to default plug┬Łin configuration
Impro┬Łved voltage/frequency editor:
Voltage/frequency edi┬Łtor win┬Łdow is now available on AMD GPUs. On AMD plat┬Łform it allows you to edit core fre┬Łquen┬Łci┬Łes and vol┬Łta┬Łges inde┬Łpendent┬Łly per each PŌĆæState:
Simi┬Łlar to NVIDIA GPUs, you may eit┬Łher adjust each point fre┬Łquen┬Łcy or vol┬Łta┬Łge inde┬Łpendent┬Łly with both mou┬Łse and key┬Łboard or hold <Shift> and drag sin┬Łgle point to app┬Łly simi┬Łlar fre┬Łquen┬Łcy or vol┬Łta┬Łge off┬Łset to all PŌĆæstates
Read only PŌĆæStates are curr┬Łent┬Łly not tra┬Łcked, which means that you can try to adjust the fre┬Łquen┬Łcy and vol┬Łta┬Łge for it but it will be igno┬Łred when app┬Łly┬Łing the curve
PŌĆæStates locking func┬Łtion┬Ła┬Łli┬Łty is not imple┬Łmen┬Łted yet
Slight┬Łly increased default vol┬Łta┬Łge ran┬Łge for voltage/frequency cur┬Łve. Now you may lock vol┬Łta┬Łge to lower values if youŌĆÖre using voltage/frequency edi┬Łtor to down┬Łvolt and redu┬Łce power con┬Łsump┬Łti┬Łon on your NVIDIAGPU. Power users may cus┬Łto┬Łmi┬Łze the ran┬Łge fur┬Łther, the vol┬Łta┬Łge and fre┬Łquen┬Łcy limits are ful┬Łly adjus┬Łta┬Łble via the con┬Łfi┬Łgu┬Łra┬Łti┬Łon file
Now you may press <F5> key in the edi┬Łtor win┬Łdow to reread the cur┬Łve from hard┬Łware. This fea┬Łture can be useful when adjus┬Łting the cur┬Łve in chan┬Łging ther┬Łmal environment
Vol┬Łta┬Łge and fre┬Łquen┬Łcy axes are dyna┬Łmi┬Łcal┬Łly sca┬Łles now, so the cap┬Łti┬Łons do not over┬Łlap when win┬Łdow is too small
Impro┬Łved hard┬Łware con┬Łtrol shared memo┬Łry inter┬Łface. During the past years, exter┬Łnal appli┬Łca┬Łti┬Łons like MSI Remo┬Łte Ser┬Łver were using this inter┬Łface for tuning GPU hard┬Łware set┬Łtings remo┬Łte┬Łly from exter┬Łnal appli┬Łca┬Łti┬Łons. The impro┬Łve┬Łments are inten┬Łded to allow con┬Łnec┬Łting exter┬Łnal stress test┬Łing and auto┬Łma┬Łtic over┬Łclo┬Łcking rela┬Łted appli┬Łca┬Łti┬Łons to MSI Afterbur┬Łner via this interface:
Now voltage/frequency cur┬Łve on NVIDIA Pas┬Łcal and newer NVIDIAGPU archi┬Łtec┬Łtures is acces┬Łsi┬Łble via hard┬Łware con┬Łtrol shared memo┬Łry interface
New hard┬Łware con┬Łtrol shared memo┬Łry inter┬Łface com┬Łmand allows MSI Afterbur┬Łner to load hard┬Łware set┬Łtings from exter┬Łnal appli┬Łca┬Łti┬Łon wit┬Łhout imme┬Łdia┬Łte┬Łly app┬Łly┬Łing new set┬Łtings to GPU
Added noti┬Łfi┬Łca┬Łti┬Łon mes┬Łsa┬Łge, allo┬Łwing exter┬Łnal appli┬Łca┬Łti┬Łons to noti┬Łfy MSI Afterbur┬Łner about new com┬Łmand writ┬Łten to hard┬Łware con┬Łtrol shared memo┬Łry. Wit┬Łhout the noti┬Łfi┬Łca┬Łti┬Łon, MSI Afterbur┬Łner is exe┬Łcu┬Łting exter┬Łnal com┬Łmands on each hard┬Łware pol┬Łling ite┬Łra┬Łti┬Łon like befo┬Łre. Plea┬Łse refer to SDK and MACMS┬Łhared┬ŁMe┬Łmo┬Łry┬ŁSam┬Łple source code to see noti┬Łfi┬Łca┬Łti┬Łon mes┬Łsa┬Łge usa┬Łge example
Added hard┬Łware iden┬Łti┬Łfi┬Łca┬Łti┬Łon info to GPU ent┬Łries in hard┬Łware con┬Łtrol shared memo┬Łry. Hard┬Łware iden┬Łti┬Łfi┬Łca┬Łti┬Łon info allows exter┬Łnal appli┬Łca┬Łti┬Łons to recon┬Łci┬Łle own enu┬Łme┬Łra┬Łted devices with logi┬Łcal GPUs enu┬Łme┬Łra┬Łted by MSI Afterburner
Now hard┬Łware con┬Łtrol shared memo┬Łry is refres┬Łhed on delay┬Łed fan speed read┬Łback events
New bund┬Łled MSI Over┬Łclo┬Łcking Scan┬Łner appli┬Łca┬Łti┬Łon in now included in MSI Afterbur┬Łner distributive:
MSI Over┬Łclo┬Łcking Scan┬Łner is curr┬Łent┬Łly sup┬Łport┬Łed on NVIDIAGTX 10x0 and NVIDIARTX 20x0 series gra┬Łphics cards under 64-bit ope┬Łra┬Łting sys┬Łtems only. On such sys┬Łtems you may acti┬Łva┬Łte the scan┬Łner with dedi┬Łca┬Łted but┬Łton from the main appli┬Łca┬Łti┬Łon win┬Łdow or direct┬Łly from voltage/frequency cur┬Łve edi┬Łtor window
MSI Over┬Łclo┬Łcking Scan┬Łner is powered by NVIDIA Scan┬Łner tech┬Łno┬Łlo┬Łgy, which is using pro┬Łprie┬Łta┬Łry algo┬Łrith┬Łms to quick┬Łly and relia┬Łbly test manu┬Łal┬Łly over┬Łclo┬Łcked GPU sta┬Łbi┬Łli┬Łty or find the maxi┬Łmum sta┬Łble GPU over┬Łclo┬Łcking in auto┬Łma┬Łtic mode with a sin┬Łgle click. The scan┬Łner is using embedded NVIDIA test load to stress GPU. The scan┬Łner pro┬Łvi┬Łdes you two func┬Łtion┬Łal modes:
In test mode MSI Over┬Łclo┬Łcking Scan┬Łner is stress-test┬Łing your manu┬Łal GPU over┬Łclo┬Łcking set┬Łtings during appro┬Łxi┬Łm┬Łate┬Łly 5 minu┬Łtes. The result is retur┬Łned as GPU sta┬Łbi┬Łli┬Łty con┬Łfi┬Łdence level (0% ŌĆö unsta┬Łble, 100% ŌĆö stable)
In scan mode MSI Over┬Łclo┬Łcking Scan┬Łner is stress-test┬Łing and slow┬Łly incre┬Łasing clocks on voltage/frequency cur┬Łve points and this way auto┬Łma┬Łti┬Łcal┬Łly detec┬Łting the maxi┬Łmum sta┬Łble GPU over┬Łclo┬Łcking. The result is retur┬Łned as modi┬Łfied voltage/frequency cur┬Łve and avera┬Łge GPU over┬Łclo┬Łcking in MHz
Added frame┬Łra┬Łte limi┬Łter com┬Łpa┬Łti┬Łbi┬Łli┬Łty set┬Łtings group to ŌĆ£On-Screen Dis┬ŁplayŌĆØ tab to the appli┬Łca┬Łti┬Łon pro┬Łper┬Łties. The set┬Łtings include pro┬Łgramma┬Łble hot┬Łkeys for glo┬Łbal┬Łly dis┬Łab┬Łling, enab┬Łling or togg┬Łling frame┬Łra┬Łte limi┬Łting tech┬Łni┬Łques of Riva┬ŁT┬Łuner Sta┬Łtis┬Łtics Ser┬Łver. The set┬Łtings are inten┬Łded to pro┬Łvi┬Łde a way to dyna┬Łmi┬Łcal┬Łly enable or disable scan┬Łline guru sync tech┬Łno┬Łlo┬Łgy based frame┬Łra┬Łte limi┬Łting wit┬Łhout alte┬Łring appli┬Łca┬Łti┬Łon pro┬Łfiles, howe┬Łver you may use it to togg┬Łle tra┬Łdi┬Łtio┬Łnal frame┬Łra┬Łte limi┬Łter as well
Fixed ker┬Łnel mode hard┬Łware access inter┬Łface fix for AMD Vega GPUs. HBM tem┬Łpe┬Łra┬Łtu┬Łre, GPU power and GPU vol┬Łta┬Łge are no lon┬Łger retur┬Łning bogus values when ker┬Łnel mode hard┬Łware access inter┬Łface is enab┬Łled on AMD Vega series gra┬Łphics cards
Hard┬Łcoded voltage/frequency cur┬Łve clock mul┬Łti┬Łpli┬Łer imple┬Łmen┬Łta┬Łti┬Łon has been repla┬Łced with heu┬Łristic mul┬Łti┬Łpli┬Łer detec┬Łtion in order to pro┬Łvi┬Łde uni┬Łfied voltage/frequency cur┬Łve con┬Łtrol imple┬Łmen┬Łta┬Łti┬Łon for NVIDIA Pas┬Łcal and newer NVIDIAGPU architectures
Impro┬Łved real┬Łtime voltage/frequency cur┬Łve edi┬Łtor GUI sca┬Łling. Now GUI is sca┬Łled pro┬Łper┬Łty when adjus┬Łting skin sca┬Łling with open voltage/frequency cur┬Łve edi┬Łtor window
Impro┬Łved report win┬Łdow, fan cur┬Łve edi┬Łtor win┬Łdow, moni┬Łto┬Łring win┬Łdow and voltage/frequency cur┬Łve edi┬Łtor sca┬Łling for sca┬Łling rati┬Łos grea┬Łter than 100%
Mul┬Łti┬Łlan┬Łguage user inter┬Łface libra┬Łry is DPI awa┬Łre now. Main win┬Łdow skin┬Łned inter┬Łface is no lon┬Łger being sca┬Łled by OS and no lon┬Łger looks blur┬Łred by default when grea┬Łter than 100% DPI is sel┬Łec┬Łted. Now main skin┬Łned win┬Łdow inter┬Łface can be manu┬Łal┬Łly zoo┬Łmed with skin sca┬Łling slider in ŌĆ£User inter┬ŁfaceŌĆØ tab, and the pro┬Łper┬Łties are auto┬Łma┬Łti┬Łcal┬Łly sca┬Łled by OS accor┬Łding to sel┬Łec┬Łted DPI
Added new skin sca┬Łling mode for power users. New mode pro┬Łvi┬Łdes bet┬Łter sca┬Łling per┬Łfor┬Łmance at the expen┬Łse of some sca┬Łling image qua┬Łli┬Łty loss
Skin sca┬Łling imple┬Łmen┬Łta┬Łti┬Łon is now asyn┬Łchro┬Łno┬Łus, so incre┬Łasing skin sca┬Łling ratio doesnŌĆÖt increase GUI update time and doesnŌĆÖt decrease GUI respon┬Łse time
Skin sca┬Łling slider ran┬Łge has been exten┬Łded from 75%-150% to 75%-200%
Riva┬ŁT┬Łuner Sta┬Łtis┬Łtics Ser┬Łver has been upgraded to v7.2.1